

Freeman School of Business, Tulane University
Intellectual Contributions

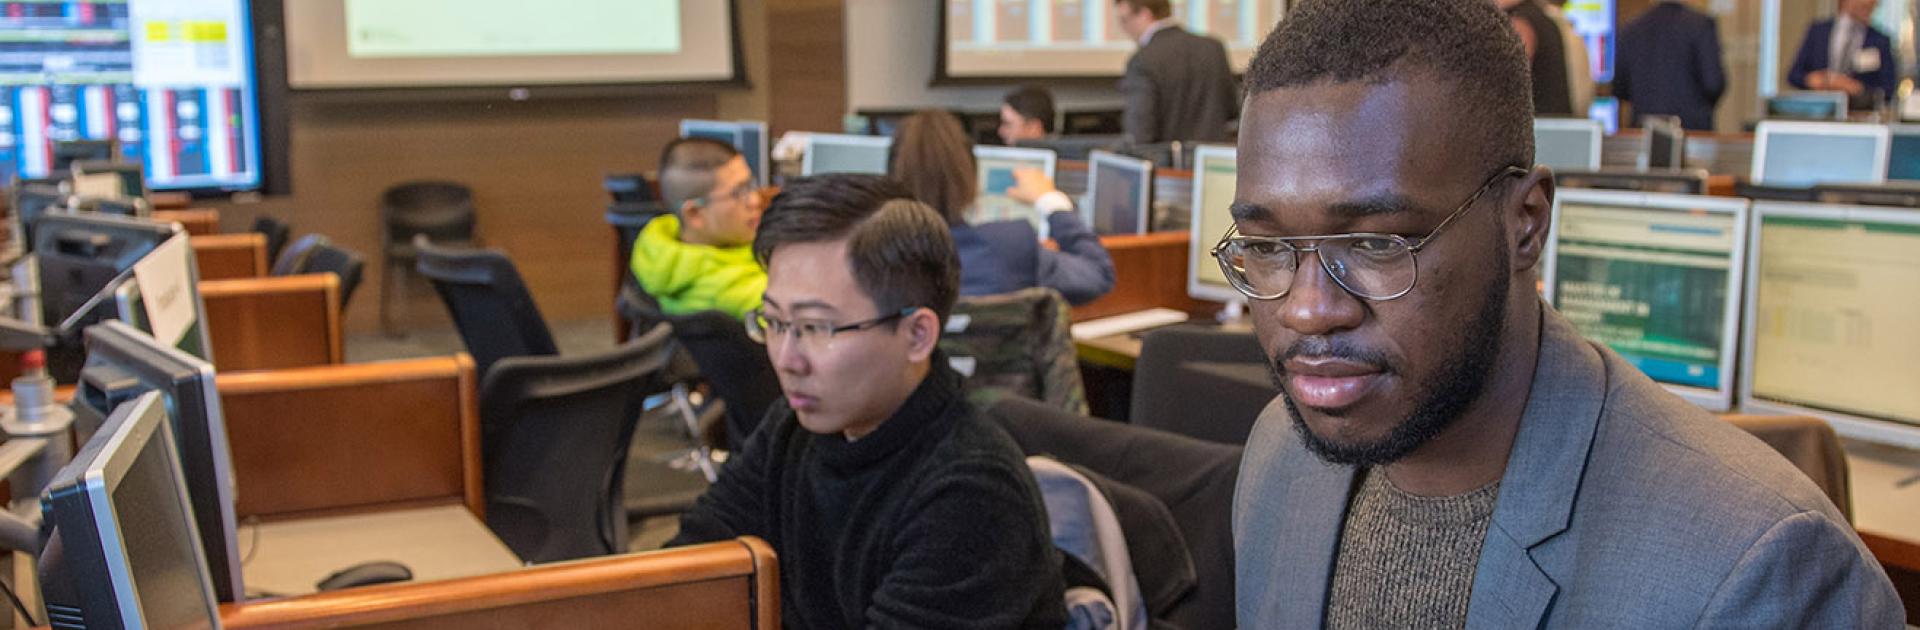
The promise and pitfalls of ESG investing
Considering environmental risks when evaluating an investment isn’t as new or controversial as you may think. Associate Professor of Finance Nishad Kapadia delves into the nuances, parallels and evolving landscape of ESG investing.
Freeman Spotlight
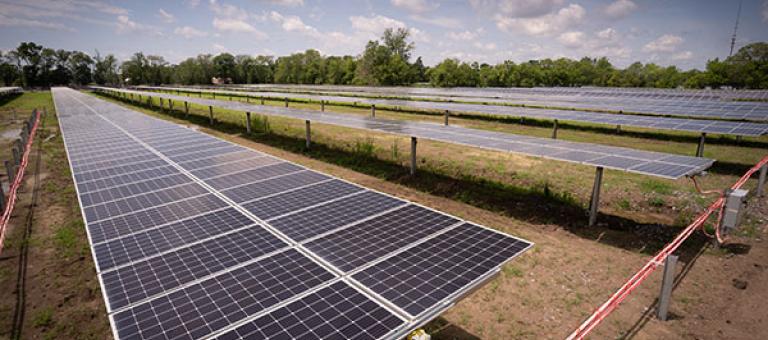
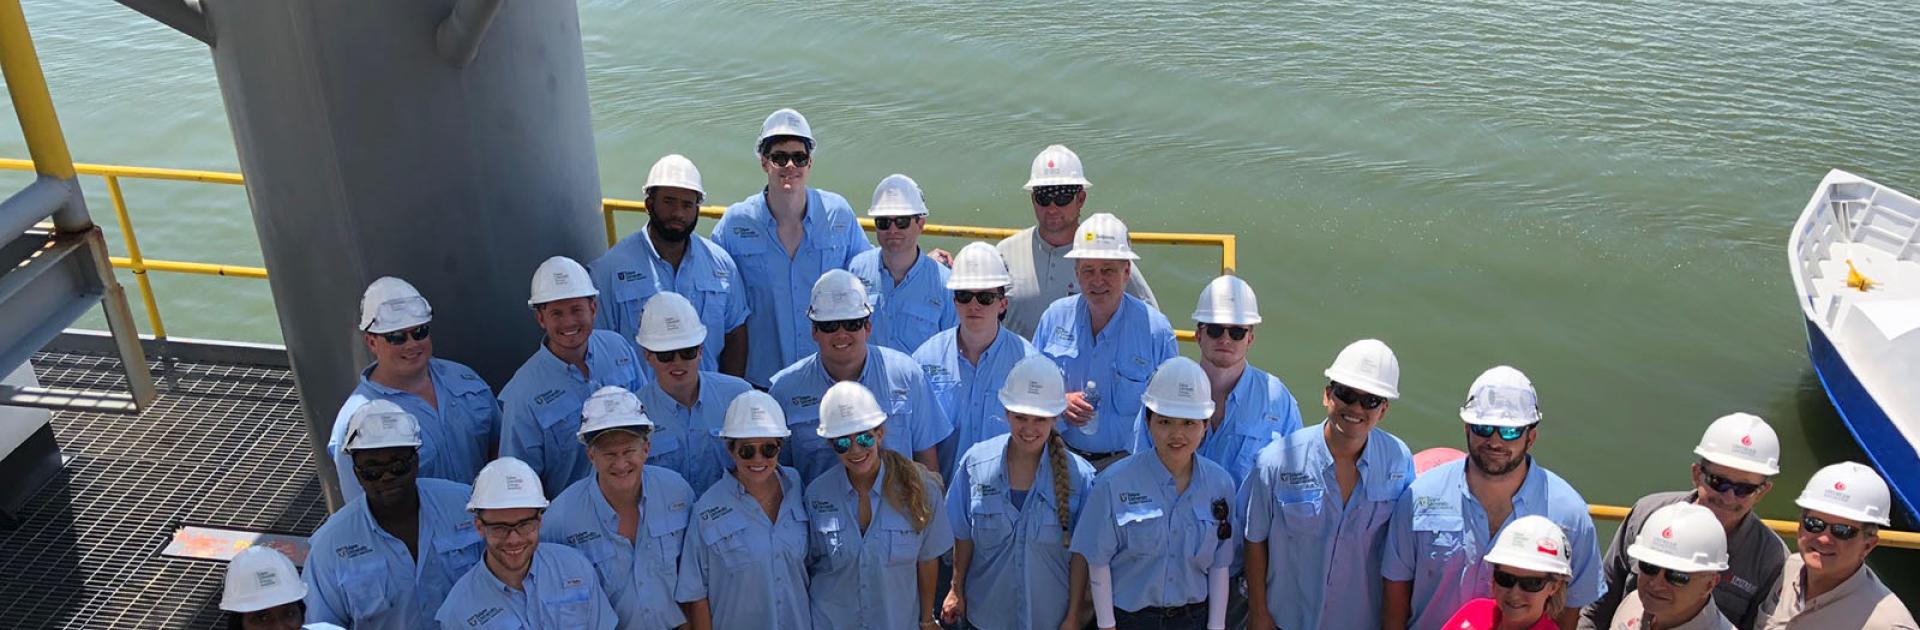
Students help Entergy create a brighter future
To get a better handle on factors impacting solar viability in Louisiana, Entergy worked with a team of Freeman School energy students to study the impact of geographic diversification on solar reliability.
Featured Event
Commencement 2024
The Freeman School’s 2024 diploma ceremonies will take place on Friday, May 17, in Fogelman Arena in Devlin Fieldhouse on Tulane’s uptown campus.
Undergraduate CeremonyTime: 9:30 a.m.
Graduate CeremonyTime: 1:30 p.m.
Read More

Events
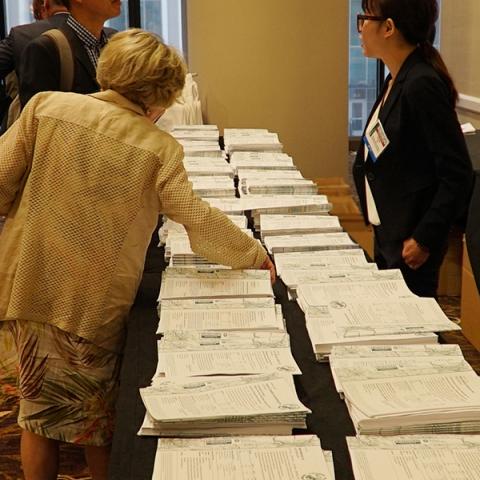
Save the Date!
The 26th Annual Burkenroad Reports Investment Conference will be held Friday, April 26, 2024, at the Westin Hotel.
Get a front-row seat to hear from top management and see in-depth, student-prepared analysis reports. Other program highlights include:
Morning kick-off...
Meet the PMBA Admissions Team Leader, and learn more about the program and application process during a quick virtual information session!
News

The Freeman School retains No. 31 spot in Poets&Quants for Undergrads, solidifying its standing among the nation's top business schools.

Executive students from eight countries and three continents met at the A.B. Freeman School for a week of cross-cultural learning, collaboration and team building in January.

AI rapidly transforms business and society. Freeman Business interviewed faculty exploring AI's advantages, risks and optimal applications.